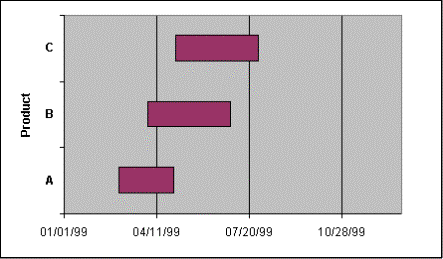
Consider a company that wants to manufacture new toys every so often. It has three products codenamed A, B, and C respectively. Management would like a chart illustrating when each product will be made. The firm's production plans are:

First, using the data above, create the table below:

Note that the Duration column contains the formulas:

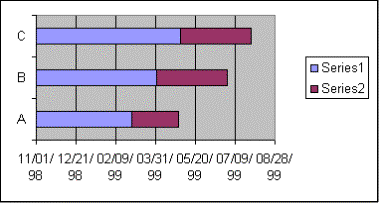
Next create a bar chart (sub-type: stacked):

Finally, modify the result by setting the first (blue) series to no border and no area and adjusting the axis values (min. and max.), and other formatting changes:
