A binary clock, or more accurately a binary-coded decimal clock, shows each number in binary. I first saw one at a friend’s place and it served as an interesting ice breaker. The image of a binary clock (Figure 1) is from Wikipedia.
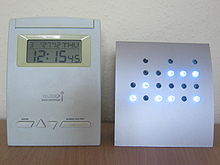
Figure 1 – Binary Clock
http://upload.wikimedia.org/wikipedia/commons/thumb/a/a3/Digital-BCD-clock.jpg/220px-Digital-BCD-clock.jpg
[For the Wikipedia article on the subject visit http://en.wikipedia.org/wiki/Binary_clock]
The below image is from Excel. Specifically, it is an Excel chart, though most would be hard pressed to recognize it as such. It represents the time 14:30:26 (i.e., 26 seconds past 2:30 pm).

Figure 2
In binary-coded decimal notation each decimal digit in a number is independently represented by its binary equivalent. Since a digit can only be between 0 and 9, we need no more than 4 bits for each digit. As an example, the decimal number 12 becomes 0001 0010 using 4 bit binary numbers. Similarly, the time 23:59:59 (or 1 second before midnight on a 24hour clock) becomes 0010 0011 0101 1001 0101 1001.
In a BCD clock, the binary bits (on or off) are shown vertically rather than horizontally. So, we need 4 indicators arranged vertically for each digit. The physical binary clock has LEDs that are on or off. In an Excel chart, we can simulate that effect with a marker that is somewhat faded (for a LED that is off) and a more noticeable color (for a LED that is on) as in Figure 2.
The Excel binary clock starts with a XY Scatter chart. There are 6 columns of markers with a gap after each set of 2. So, in total, we need 8 x values. The values themselves are not important – use 1, 2, 3… 8.
Each horizontal set of markers is represented by the same y value (y=1 is one set of horizontal markers, y=2, a second set, etc.). The four markers in a vertical column require the use of 4 y values, y=1,2,3,4. Of course, the tens digit for the hour will never be more than 2, which means we need only 2 binary digits for the hour. Similarly, the tens digits for the minute and the second will never be more than 5. So, we need only 3 markers for those digits.
In the worksheet snapshot below, the X values are shown in the top row and each set of successive Y values are in the rows below the X values. There is an easier arrangement of the data but the one used here could also be used, together with the appropriate conditional formatting, to show the BCD clock in the worksheet itself!
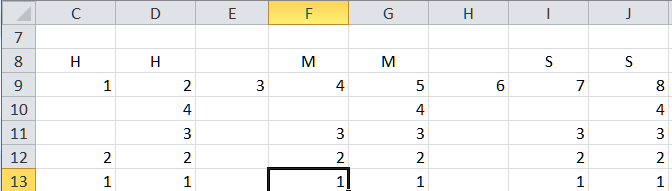
Figure 3
Select the range C9:J13 and create a XY Scatter Chart with 4 series (make sure Excel knows that the data are in rows). All the series will share row 9 as the X values and will have rows 10 through 13, respectively, as the Y values.
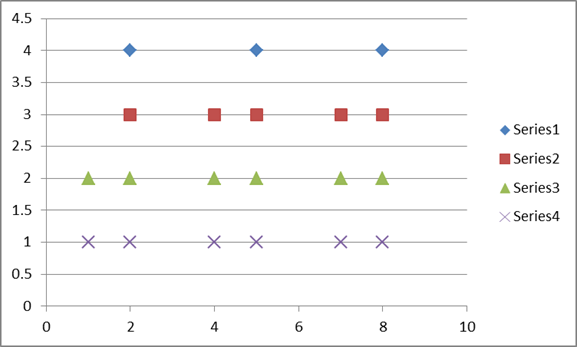
Figure 4
Hide the legend and the gridlines. Change the Y axis maximum value to 4. For both the X and Y axes hide the labels and the line.
For each of the data series, ensure the marker line color is ‘no color’, the marker type is a circle and select a light color for the marker fill as in Figure 3
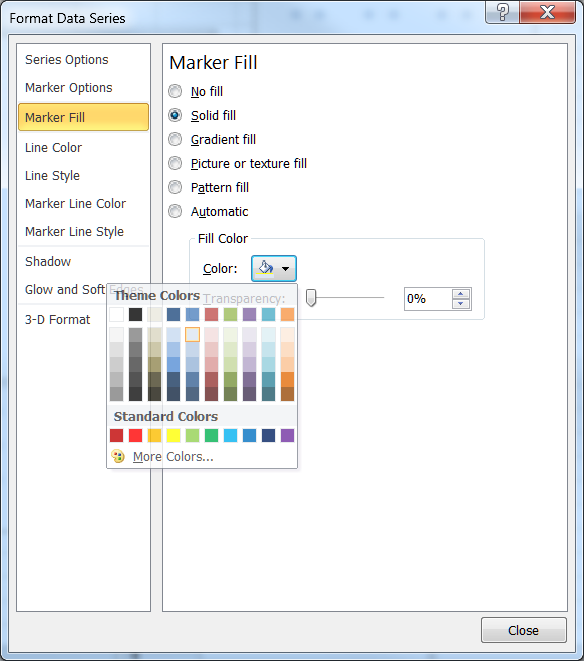
Figure 5
The result should look like:

Figure 6
This requires some amount of work. First, decompose the current time into 6 individual digits: two individual digits for each of hour, minute, and second. Then, convert each digit into the binary number. Finally, overlay the binary numbers in the chart started above.
Start with the time in, say, B2 with the formula =NOW(). Format the cell with format for Time. The result should be the time in the format hh:mm:ss.
Next, get the tens digit of the hour by entering, in C3, the formula =INT(HOUR($B$2)/10). Get the units digit with the formula =MOD(HOUR($B$2),10) in D3. Do the same for the minutes and the seconds with the corresponding formulas in F3:G3 and I3:J3.
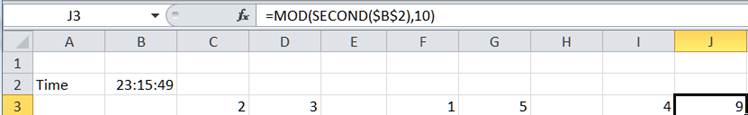
Figure 7
The method to convert a decimal number to its binary equivalent is easily found by searching Google. One of the leads is the WikiHow article How to Convert from Decimal to Binary (http://www.wikihow.com/Convert-from-Decimal-to-Binary). In our case, the digits are laid out not horizontally (as in 1001 for 9) but rather
|
1 |
|
0 |
|
0 |
|
1 |
Of course, the goal is to plot this on a chart using up to 4 markers
![]() .
.
So, the values to plot become
|
4 |
|
3 |
|
2 |
|
1 |
The Excel worksheet looks like the following:
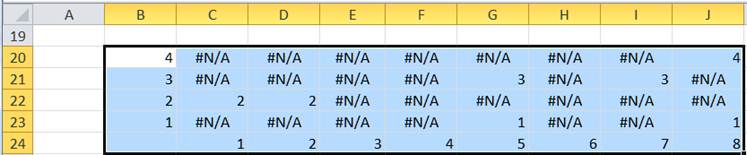
Figure 8
The formula in C20 is =IF(2^($B38-1)<=C$3,$B38,NA()) and the formula in C21 is =IF(2^($B21-1)<=C$3-SUM(2^($B$20:$B20-1)*IF(ISNA(C$20:C20),,1)),$B21,NA()).
Copy C21 down to C22:C23, then copy C20:C23 across to D:J.
Now, every recalculation of the workbook will cause the =NOW() in B2 to change the current time. This will update C3:J3 with the individual digits of the time and that will update B20:J23 with the corresponding binary digits.
Finally, add each of the rows in B20:J23 as a separate series to the chart created earlier. For each of the 4 series the X values are in B24:J24.
Format each of these new series similarly to the ‘Off’ LEDs above except, this time pick a dark blue color for the markers.
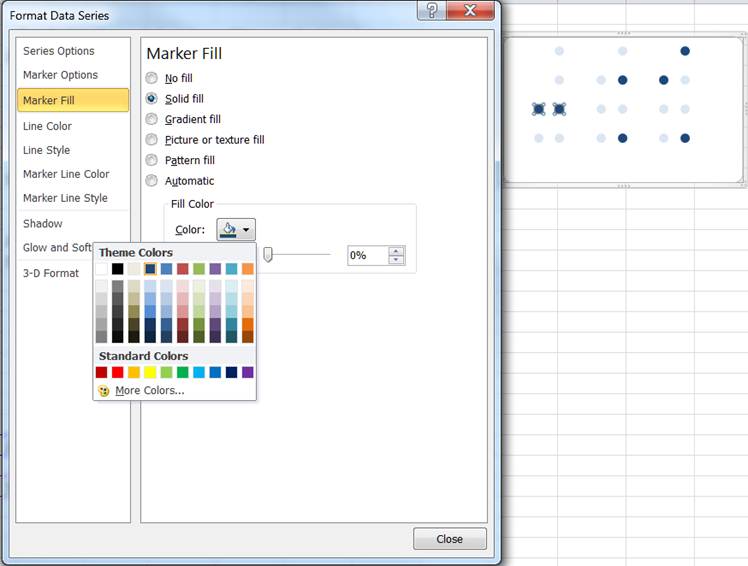
Figure 9
This yields the desired final result:

Figure 10
The downloadable zip file contains an Excel file, which includes several variants of the basic binary clock. This document does not discuss how to create the variants. The key is using data labels and various chart formatting options.
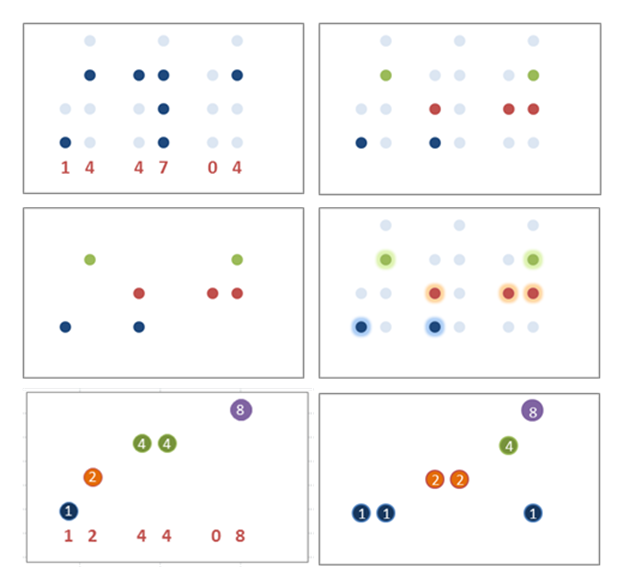
Figure 11

