Keywords: Gantt Project chart floating bar schedule function VBA code macro
Download the workbook The workbook contains the example on this page and the VBA functions mentioned. Neither the workbook nor the code is password protected.
This document provides a downloadable workbook with two immediately usable functions related to creating a Gantt (or Gantt-style) chart.
The data are expected in the form of paired "start-stop" values. These could be times or just some units of measurement. They could apply to people, tasks, or arbitrary "things."
Function 2: convertOnToDisplay
The first function, mergeDatasets, provides a "merged" result from individual data sets. It takes the individual "start-stop" information for multiple entities and provides a single merged "start-stop" list.
=mergeDatasets([individual data sets])
Each individual data set is specified as a separate argument.
Enter the function as an array formula in an even number of cells. To complete an array formula, do *not* use the ENTER key but the CTRL+SHIFT+ENTER combination.
It is important that individual data sets are specified separately. Even if they are in adjacent columns (or rows), do not specify them as a single range. In the examples below, even though the P1, P2, and P3 information are in adjacent columns, the correct way to use the function is the specify each column separately.
Select enough cells to enter the formula so that you see at least one #N/A pair.
To follow along with the example, select 14 cells in a column and use the array formula
=mergeDatasets(B3:B6,C3:C6,D3:D8)
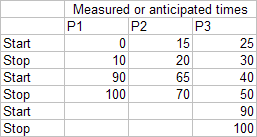
In the Example 1a, the start-stop information for P1, P2, and P3 contain no overlap except in the 90-100 region and the merged "start-stop" list reflects that. If the data represented when P1, P2, and P3 were "on" (in a call center or on guard duty or on station in a control room), the merged result provides information when at least one person was "on." In this example, having all three on at the same time still leaves several gaps in coverage.
 |
 |
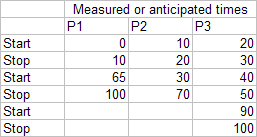
Example 2a, on the other hand, contains complete overlap. Consequently, the "Merged" list has only a single "start-stop" pair.
 |
 |
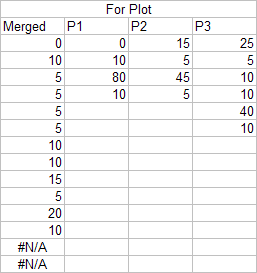
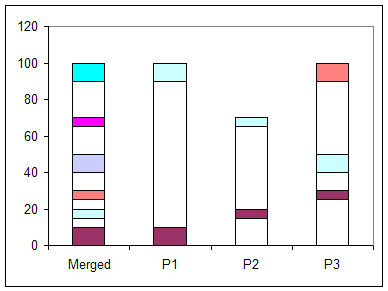
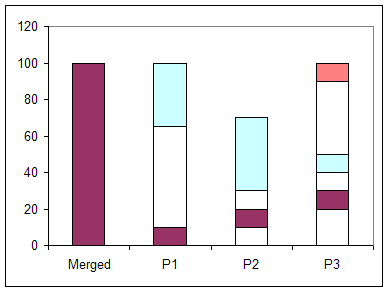
The second function, convertOnToDisplay, converts the start-stop pairs into a form compatible for plotting in a stacked column chart (or a stacked bar chart).
=convertOnToDisplay([data set with start-stop information], [minimum value in data set])
The first argument is any one data set with start-stop information. This could be individual information (as for P1, P2, or P3 in the example) or a merged data set that is the result of the convertOnToDisplay function.
The second argument indicates the starting value for the plotted data. This takes into account scenarios where the first start time for an individual is not the start time for the group as in the cases of P2 and P3 in the example shown.
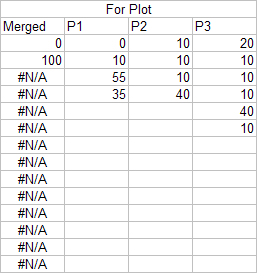
=convertOnToDisplay(H3:H16,0)
 |
 |
 |
 |
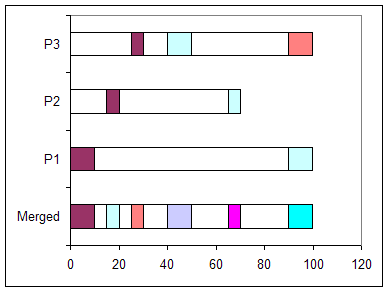
The chart does not have to be a column chart. It could just as easily be a bar chart as below.
 |