![]() 2010 (32 bit and 64 bit)
2010 (32 bit and 64 bit)
![]() 2007
2007
This add-in creates a dashboard from the contents of a PivotTable. Each chart in the dashboard shows the last of the row fields and the data field. Elements of the chart are customizable. The example below shows a PivotTable reporting on the number of annual scans of different types performed by each technologist at a radiology department with two locations (the 2011 data are projected scan volume). The PivotTable has 4 row fields (Year, Location, Modality, and Technologist) and 1 data field (Sum of Scan). The dashboard consists of 1 chart for each combination of Year, Location, and Modality with each chart showing the number of scans by technologist.
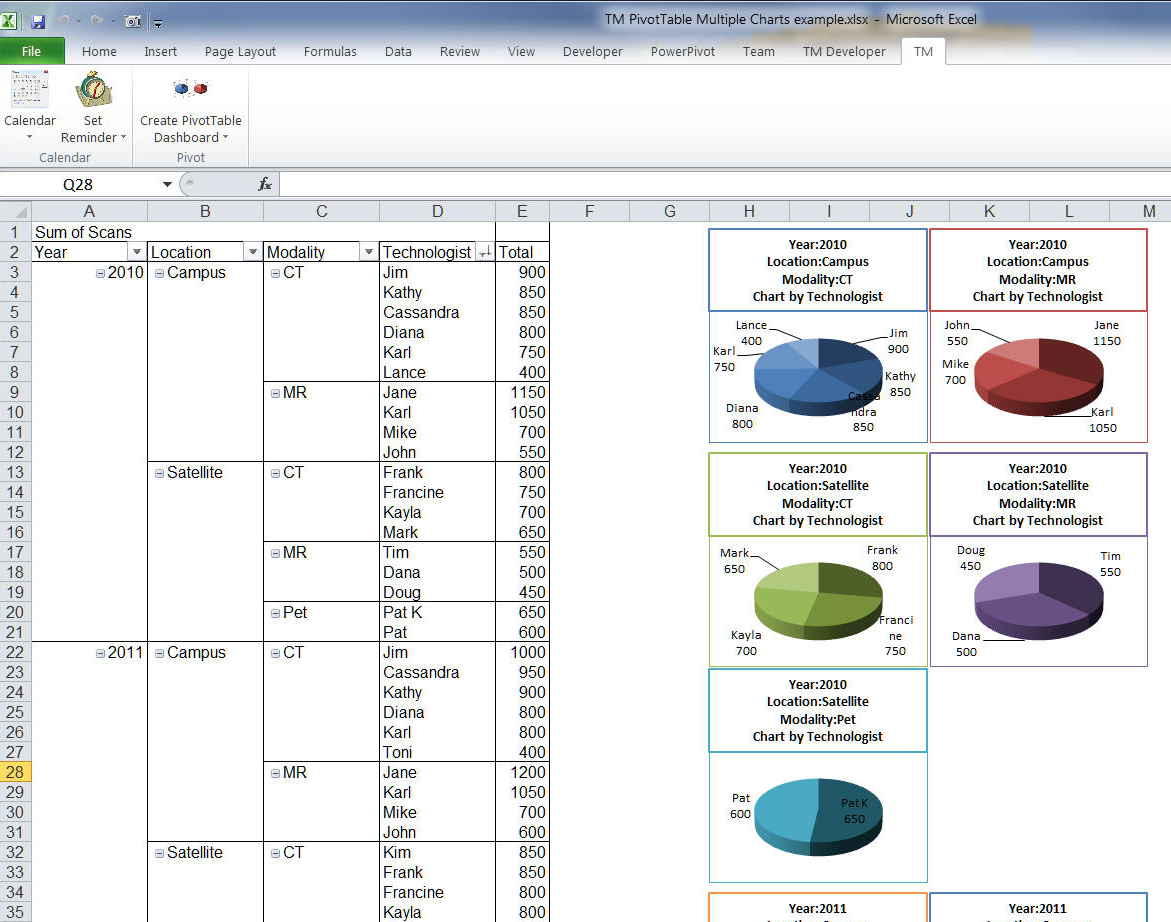
The location of the dashboard is consumer-specified.
The add-in can create a default chart or one can specify a template chart. Certain elements of this template chart are customizable.
The pivot table can have any number of row fields, one and only one data field, and no column fields.
Note that the self-installer version also installs an uninstall capability. From the Windows Taskbar, select Start | Control Panel ► Add or Remove Programs... | scroll down to the TM PivotTable entry.
If you chose to download the zip version, unzip the add-in file to a directory of your choice.
For installation instructions see common installation instructions. In Excel 2007 or 2010, load the TM PivotTable (Ribbon UI) add-in.
For more see the documentation.
Version 1.0

