How to use the TM Tornado add-in
Draw a vertical line in a Tornado Diagram
Sensitivity analysis of the nytimes.com paywall
Tornado diagrams graphically display the result of single-factor sensitivity analysis. This lets one evaluate the risk associated with the uncertainty in each of the variables that affect the outcome. Single-factor analysis means that we measure the effect on the outcome of each factor, one at a time, while holding the others at their nominal (or base) value. The software adjusts each factor between the specified minimum (or low) and maximum (or high) values while recording the value of the outcome. It then plots the resulting data in a bar chart. A typical diagram looks like Figure 1, which shows the effect of four parameters on the result. The uncertainty in the parameter associated with the largest bar, the one at the top of the chart, has the maximum impact on the result, with each successive lower bar having a lesser impact. This arrangement is why the result is called a Tornado Diagram.
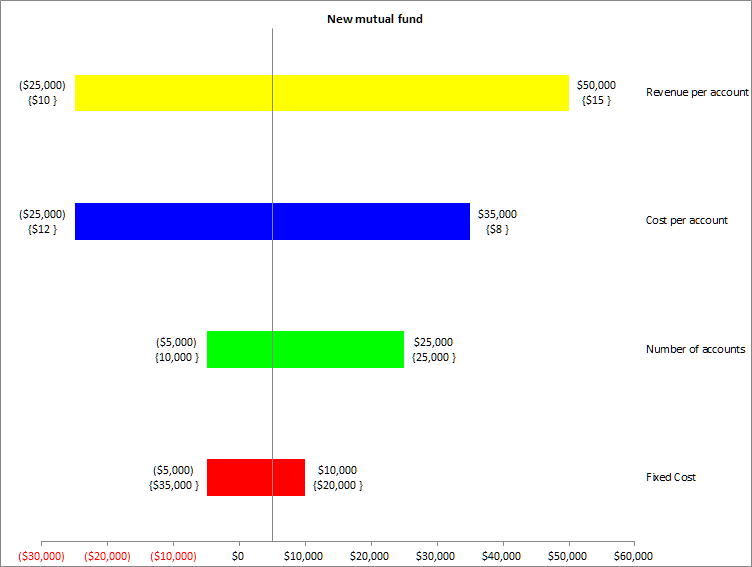
Figure 1
The vertical axis corresponds to the result when all the factors (also called parameters or variables) are at their respective nominal (or base) values. For each of the uncertain parameters, the chart contains one horizontal bar and two sets of numbers, one of the left and the other to the right of the bar. Each set of numbers contains the result value (upper number) and the value of the parameter at which the result was reached (the lower number within curly brackets). Negative numbers are shown in parenthesis.
In the example shown in Figure 1, a financial institution is evaluating whether it should start a new mutual fund. It expects that the top four items to affect profitability will be Revenue-per-account, Cost-per-account, the Number of Accounts, and the Fixed Cost of running the fund. The Revenue-per-account has the greatest impact on the profitability of the new mutual fund. It also has estimates for the base values of each of these factors, as well as the low and high values. These are shown in Figure 2.
Figure 2
The firm calculates the profit as Number_of_accounts * ( Revenue_per_account - Cost_per_account) - Fixed_Cost.
With all the other parameters at their respective nominal values, if the per-account revenue comes in at the low estimate of $10, the fund will lose $25,000 dollars. On the other hand, if the per-account revenue is at the high end of $15, the fund profit will be $50,000 . The variable with the next largest impact is the cost-per-account. If it comes in at the high end of $12, the fund will lose $25,000 whereas if the cost is at the low end of $8, the firm will earn $35,000 in profit. Again, remember that all the other parameters are maintained at their respective nominal values and only one factor is changed at a time.
If you downloaded the executable, double-click it and follow the prompts to install the add-in in the folder of your choice.
If you downloaded the zip file, unzip it and extract the files to a location of your choice.
Office programs have a default location for add-ins. It is the most convenient location for this add-in. The location of this default folder has changed with different versions of the software. To locate this folder on your computer, open Excel, then select Tools | Add-Ins (or the equivalent in Excel 2007 or later). In the Add-Ins dialog box, click the Add New.. button. This will open in the default folder used by Excel for add-ins.
To ensure you use the correct security settings and to install and load the add-in, see Common Installation Instructions for Office add-ins
In Excel 2003 (or earlier), in the Add-Ins dialog box, select the TM Tornado entry.
In Excel 2007 (or later), in the Add-Ins dialog box, select the TM Tornado (Ribbon UI) entry.
The TM Tornado add-in is now available for use.
In Excel 2003 or earlier, the add-in select TM | TM Tornado > Tornado Diagram...
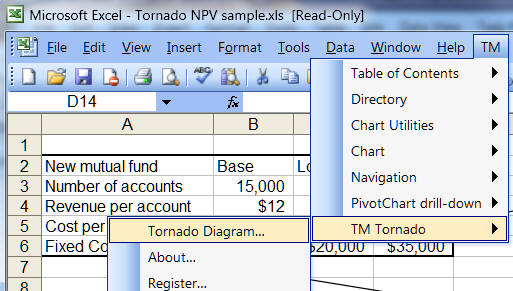
Figure 3
In Excel 2007 or later, click the
TM tab | Data Analysis
group | Tornado Diagram button.

Figure 4
This will bring up the TM Tornado dialog box.
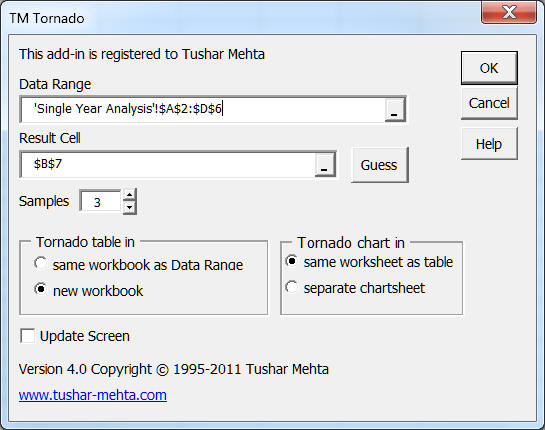
Figure 5
Data Range: This specifies the individual factors (variables) that affect the outcome together with their respective nominal (or base) values, together with the minimum, and maximum values. To create a Tornado diagram , lay out the data so that the nominal (or base) values and the minimum and the maximum values are in adjacent columns as shown in Figure 6. Please remember to include the top header row in the data range in the Tornado dialog box.
Figure 6 -- Data Range Specification
Result Cell: This is the cell that contains the value of the outcome. It should have a formula that references, directly or indirectly, the base cells of each of the factors.
Figure 7
-- Result Cell
In this example, the formula in the result cell is shown in Figure 8.
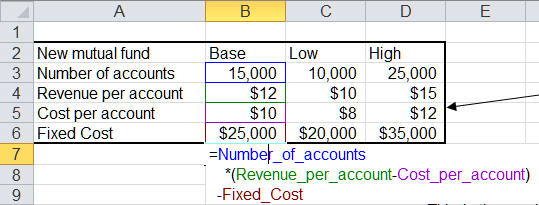
Figure 8 -- Formula in
the result cell references the base cell of each of the factors.
The number of samples affects the time required for the analysis as well as the accuracy of the result. Since the software samples the parameter values, increasing the sample size will take longer but will yield more accurate results. Of course, there is no substitute for understanding the problem being studied. For example, if the relationship between the result cell and the parameters in the Data Range is linear, a sample size of 3 will suffice. More complex relationships will require more samples.
There are scenarios where it might help to have a vertical line (or lines) in a Tornado Diagram. In our example, suppose we want to see where each of the outcome for each of the factors crosses $20,000. Use the 'Draw Vertical Line' feature of the TM Tornado add-in. In Excel 2007 or later select a chart, then click Chart Tools contextual ribbon | TM tab | Chart Utilities group | Draw Vertical Line button. In Excel 2003, select a chart, then click TM | Chart Utilities > Draw a Vertical Line... menu item.
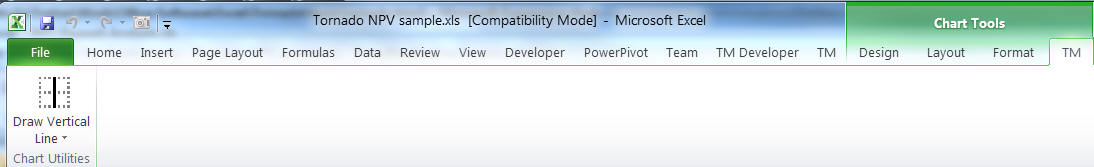
Figure 9
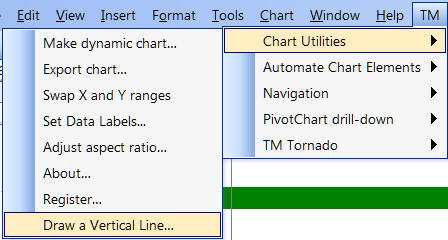
Figure 10
This will bring up the TM Tornado: Draw a Vertical Line dialog box. Enter a number, the y value, at which to draw the vertical line.
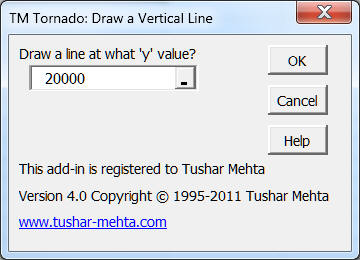
Figure 11
The result, shown in FIgure 12, shows a vertical line at $20,000 on the horizontal axis.

Figure 12
In March 2011, The New York Times introduced a 'paywall' for its website www.nytimes.com. Basically, the fairly complex scheme offers all visitors limited free access to the nytimes.com website. Certain visitors, after they reach the free access limit, will then have a choice of different subscription services. The publisher of the newspaper outlined the details of the scheme in The Times Announces Digital Subscription Plan (http://www.nytimes.com/2011/03/18/business/media/18times.html?src=me&ref=business).
As can be expected many have much to say about this scheme including critiques by Frédéric Filloux in NYTimes’ “Fair” Prices (http://www.mondaynote.com/2011/03/21/nytimes-“fair”-prices/) and Felix Salmon in How the NYT paywall could turn out to be a success (http://blogs.reuters.com/felix-salmon/2011/03/23/how-the-nyt-paywall-could-turn-out-to-be-a-success/).
In my case, I was working on UI changes to the TM Tornado add-in and on revising the documentation. The timing of the announcement of the nytimes.com paywall was fortuitous in that I could use it as an example of sensitivity analysis with TM Tornado. It's also an opportunity to share how one can carry out (semi)intelligent analysis of what one reads about even while not knowing all the details behind a company's decision making process.
The workbook in Excel 97-2003 format
The result of the sensitivity analysis
The sensitivity analysis model
Based on the material I found on the web and my own estimates and guesstimates (I don't claim to have any inside knowledge of The New York Times decision making process), the result of the TM Tornado single-factor sensitivity analysis is below. It shows that the one factor that will have the largest impact of profitability is the transformation rate, i.e., the percentage of heavy users who will become paying subscribers. What is also worth nothing is that none of the factors, individually, will cause the paywall scheme to lose money.
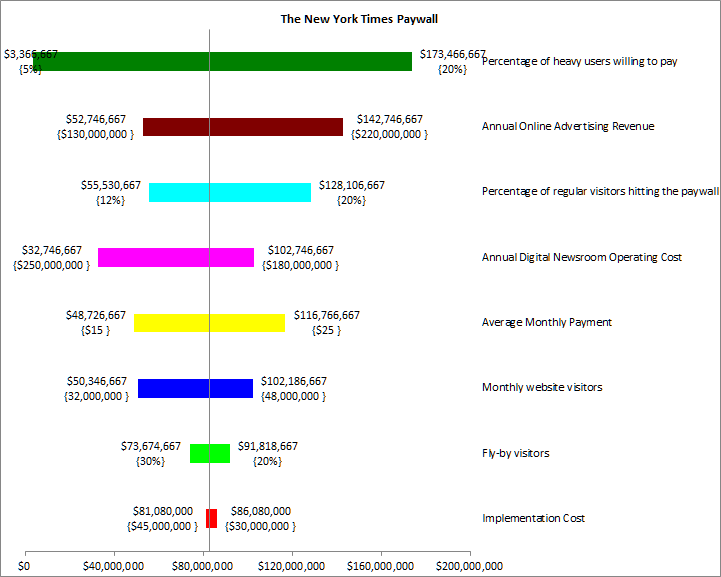
Figure 13
Of course, this analysis does not take into account the combined effect of the different factors or the likelihood of different events. For example, the combination of a low transformation rate and a low monthly payment and a high operating cost all together might result in a loss.
Frédéric Filloux's analysis (summarized below) developed point estimates for each of the variables. What that means is that each uncertain variable (for example transformation rate) is fixed at some value. As a first cut at incorporating the uncertainty associated with the variables, we used single-factor sensitivity analysis with the help of TM Tornado.
Lacking additional "inside" information about the NY Times paywall scheme, I made some educated guesses to arrive at the below numbers. The result is not meant to be an authoritative analysis of the NY Times paywall scheme but more a case study to illustrate single-factor sensitivity analysis with TM Tornado.
For the implementation cost, use the range of $30 million to $45 million, with a base (or most likely) value of $40 million.
For the number of monthly visitors, use the range 32 million to 48 million with a base value of 42 million.
For the "fly-by" visitors, i.e., visitors who will read an article and leave, instead of using a single estimate of 25%, use a range of 20% to 30% with a base value of 25%.
While the current estimate of "heavy" users is 15% of regular visitors, the NY Times could tweak its definition to create a different definition of a heavy user. So, use a range of 12% to 20% with a base value of 15%.
The transformation rate is the rate at which heavy users become paying subscribers. Since the range of transformation rates spans 5% to 20%, use those as the low and high values respectively. Then, opting for a "middle" number makes 12% the base value.
As others also have pointed out, I think the NY Times is overly optimistic in expecting people to fork out up to $35/4 week period for access to the content from any device. The only other comparison I could think of was with the Wall Street Journal that currently charges $17.29 (don't ask why the 29 cents) for a month. So, estimate the average monthly charge to the range of $15 to $25 with a base value of $20.
There's some debate about the value of advertising behind a paywall. By some accounts the WSJ charges a 30% premium for ads behind its paywall. Felix Salmon in his blog post postulates that if various assumptions come true, ad revenues could be "running north of $300 million per year." At the same time, I would think that people who are paying for access might not appreciate seeing all that many ads.
The range for the digital newsroom operating cost is, frankly, based on speculation.
So, we get the following range of values for all the variables. I also appropriately named the cells in column C and used those names in the various formulas in the model. To copy the Excel ranges as HTML tables and retain the formatting and include the row and column headers, I used Showing an Excel worksheet in HTML (i.e., on a web page) -- http://www.tushar-mehta.com/publish_train/xl_vba_cases/1031_excel_worksheet_to_html.shtml
| B | C | D | E | |
|---|---|---|---|---|
| 2 | The New York Times Paywall | Base | Low | High |
| 3 | Monthly website visitors | 42,000,000 | 32,000,000 | 48,000,000 |
| 4 | Fly-by visitors | 25% | 20% | 30% |
| 5 | Percentage of regular visitors hitting the paywall | 15% | 12% | 20% |
| 6 | Percentage of heavy users willing to pay | 12% | 5% | 20% |
| 7 | Average Monthly Payment | $20 | $15 | $25 |
| 8 | Annual Online Advertising Revenue | $160,000,000 | $130,000,000 | $220,000,000 |
| 9 | Annual Digital Newsroom Operating Cost | $200,000,000 | $180,000,000 | $250,000,000 |
| 10 | Implementation Cost | $40,000,000 | $30,000,000 | $45,000,000 |
And, the resulting model for sensitivity analysis:
Values:
| B | C | |
|---|---|---|
| 12 | Analysis | |
| 13 | Monthly website visitors | 42,000,000 |
| 14 | Fly-by visitors | 25% |
| 15 | Regular visitors | 31,500,000 |
| 16 | Percentage of regular visitors hitting the paywall | 15% |
| 17 | Number of regular visitors hitting the paywall | 4,725,000 |
| 18 | Percentage of heavy users willing to pay | 12% |
| 19 | Average Monthly Payment | $20 |
| 20 | Monthly Paywall Revenue | $11,340,000 |
| 21 | Annual Paywall Revenue | $136,080,000 |
| 22 | Annual Online Advertising Revenue | $160,000,000 |
| 23 | Annual Digital Newsroom Operating Cost | $200,000,000 |
| 24 | Implementation cost amortized over 3 years | $13,333,333 |
| 25 | Net Profit | $82,746,667 |
Formulas:
| 12 | Analysis | |
| 13 | =B3 | =Monthly_website_visitors |
| 14 | =B4 | =Pct_Fly_By_Vistors |
| 15 | Regular visitors | =(1-Pct_Fly_By_Vistors)*Monthly_website_visitors |
| 16 | =B5 | =Pct_visitors_at_paywall |
| 17 | Number of regular visitors hitting the paywall | =Serious__visitors*Pct_visitors_at_paywall |
| 18 | =B6 | =Pct_visitors_willing_to_pay |
| 19 | =B7 | =Avg_Payment |
| 20 | Monthly Paywall Revenue | =Nbr_visitors_at_paywall*Pct_visitors_willing_to_pay*Avg_Payment |
| 21 | Annual Paywall Revenue | =C20*12 |
| 22 | =B8 | =Annual_Ad_Revenue |
| 23 | =B9 | =Annual_Newsroom_Cost |
| 24 | Implementation cost amortized over 3 years | =Implementation_Cost/3 |
| 25 | Net Profit | =Annual_Paywall_Revenue+Annual_Ad_Revenue -Annual_Newsroom_Cost-Amortized_Implementation_Cost |
Finally, a summary of the estimates for the different variables that I found on the web. In particular, Frédéric Filloux offered a quantitative analysis of the economic rationale behind the paywall. Based on facts, estimates, and, possibly, guesstimates, he listed the following numbers:
The estimated cost of implementing the paywall: $30million to $40 million.
Total monthly visitors to the website: 48.5 million worldwide visitors with U.S. visitors being 32 million. While advertisers prefer to concentrate on the U.S. visitors, the other visitors are more likely to pay for web access.
"Fly-by" visitors (arriving through Google, Facebook, etc.): upwards of 19% and estimated at 25%
Consequently, "regular" monthly visitors: 36 million.
Percentage of "heavy" users, i.e., visitors hitting the paywall limit: 15%
This "heavy" users group, the target of the NY Times paywall scheme, contains 5.4 million visitors.
Estimated average monthly payment for those who do subscribe to the nytimes.com service: $20.
Next, he listed possible transformation rates among the 5.4 heavy users ranging from 5% (270,000 paying subscribers or revenues of $65 million) to 20% (1.08 million or $259 million). From these possibilities, he decided to use a 10% transformation rate resulting in revenues of $130 million.
Then, he added an estimated advertising revenue of $160 million to get total revenues of $290 million.
He estimated the cost of the newsroom at $200 million.
So, excluding the implementation cost that corresponds to a profit of $90 million from the paywall scheme.
Visit the author's website at www.tushar-mehta.com

