At some point after the introduction of Excel 2010, Microsoft implemented a “mashup” capability, whereby a web page, programmed in JavaScript, could interact with an Excel workbook located in Microsoft’s SkyDrive “cloud” storage. In this document, I will develop a basic mashup and then add an additional complexity in which the consumer can choose the type of chart (a Cartesian chart, i.e., XY chart, or a Polar plot)
In Figure 1, the graph on the right is an Excel workbook shown through the Excel Mashup interface. The form on the left is part of the web page. Entering new information in the form will update the workbook and result in an updated chart. A functional web page is at http://www.tushar-mehta.com/publish_train/data_visualization/excelmashup/.
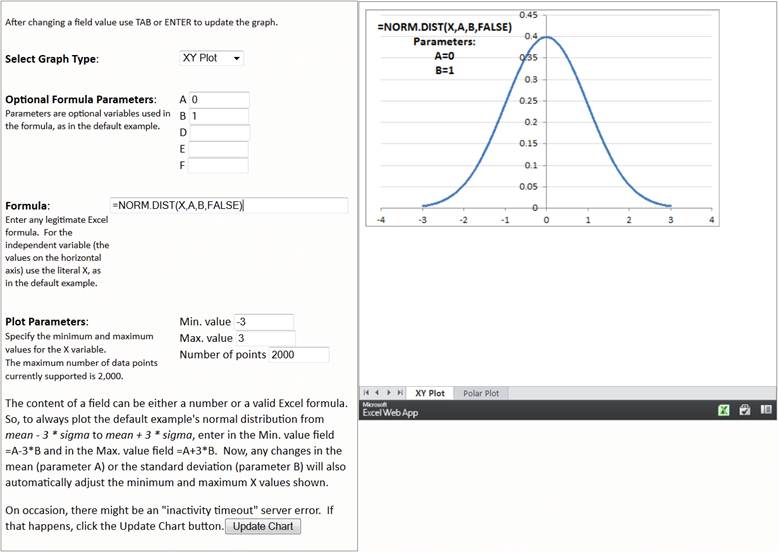
Figure 1
We will go through all the steps to create this basic mashup.
The Excel Web Access (EWA) object model
Save and configure the workbook on Skydrive
Basic requirements in the webpage
Custom JavaScript to interact between webpage elements and workbook elements
Handle direct user interaction with the Excel workbook
Most developers working with Excel use VBA or a .Net language such as VB or C#. The common paradigm for the languages, particularly in the context of legacy Office applications, is to assume that the code interaction with the application object is synchronous. There is some amount of asynchronous processing present, typically in the area of event handlers. But, even here, because of the legacy application, there is only one event handler active at any time. If multiple events occur at the same time, or if multiple handlers are waiting for one event, the application calls the event handlers sequentially.
When it comes to using JavaScript to interact with the server, the fundamental paradigm is of asynchronous activity. Typically, the JS code in the browser (running on the client machine) sends off a request to the server without waiting for a response. Sometime later, the server will respond to the browser through a callback function provided as an argument in the call to the server. This is a “more asynchronous” level of event processing than supported by Office applications.
Consequently, the developer cannot store any information in *any* global variable as one might with VBA event handling, where, at the very least, there is an assurance that only one event procedure is running at any given time.
There are various ways to “pass” information to the callback function. The method that the Excel Mashup JavaScript API uses is fairly easy to understand. When calling an API function, in addition to the callback function, one can also pass an object. This is a “pass through” object – it will be passed back untouched to the callback function.
Here’s an example. The design of the mashup described in this document creates a one-to-one association between textboxes on the web page and worksheet cells. The web page element (also called a DOM element) and the worksheet cell have the same name. When the user changes the content of a textbox, the code updates the associated worksheet cell with the new value.
The DOM element declaration includes how to process the change event.
<input id="A" name="A"
size="10" onchange="changeEvent(this)" />
A change in a textbox’s value causes the developer-written changeEvent function to be called. The argument, this, refers to the DOM object raising the change event. The changeEvent function, in turn, calls the getRangeA1Async method, which returns a range reference. The arguments to getRangeA1Async include the range id (address or name), the callback function, and the pass-through object. Since the DOM element and the worksheet range share the same name, the range identifier is the DOM element’s name (with the name of the activesheet concatenated in front). The callback function is updateRange. Finally, the pass-through object is the DOM element that triggered the change event.
function changeEvent(obj){
var SheetName = ewa.getActiveWorkbook().getActiveSheet().getName()
ewa.getActiveWorkbook().getRangeA1Async(
"'" + SheetName + "'!" + obj.name, updateRange, obj);
}
Code Sample 1
When the server calls updateRange (the callback function), it can access the pass-through object to figure out which DOM element triggered the original change request. With this architecture, the same changeEvent function and the same updateRange function can handle a change to any document element (as long as the document element and the associated worksheet range have the same name).
In the updateRange function, rslt.getReturnValue() returns the range reference and rslt.getUserContext() returns the pass-through object. So, updateRange can set the value of the worksheet range to the value of the DOM element. It does so through another asynchronous call, this time to setValuesAsync.
The same principle regarding asynchronous processing applies to setValuesAsync, i.e., include a callback function and a pass-through object. However, this time around, we don’t plan to process the result of the request. So we pass it an empty function named Dummy and a null pass-through object.
function updateRange(rslt){
var vals=new Array(1);vals[0]=new Array(1);
var obj = rslt.getUserContext()
vals[0][0] = obj.value
rslt.getReturnValue().setValuesAsync(vals,Dummy,null);
}
function Dummy(Rslt){
}
Code Sample 2
Next, we look at a slightly more complex scenario where we will have multiple concurrent asynchronous calls in progress. This happens when retrieving information from the worksheet to update the values of all the web page elements. The elements on the left side of Figure 1 are part of a form named ChangeInput. The first function in the code below, getValuesInSheet, goes through each element in the form. For each element of type text, it initiates an asynchronous call to getRangeA1Async to obtain a reference to the range object with the same name as the text element. The callback function is getRngObj, and the pass-through object is the form element. To understand the special handling of the Func element, see the section Design the workbook.
function getValuesInSheet() {
for (var i=0;i<document.ChangeInput.length;i++){
with (document.ChangeInput.elements[i]){
if (type!="text"){}
else {
var SheetName = ewa.getActiveWorkbook().getActiveSheet().getName()
ewa.getActiveWorkbook().getRangeA1Async(
"'" + SheetName + "'!" + name + ((name=="Func")?"Desc":""),getRngObj,document.ChangeInput.elements[i]);
}
}
}
}
Code Sample 3
The callback function, getRngObj, builds a reference to the range object and initiates an asynchronous call to getValuesAsync. This time around the callback function is getRngVals. getValuesAsync does nothing more to the pass-through object than pass it through.
Finally, getRngVals updates the value of the pass-through object with the returned value.
function getRngObj(rslt){
var rng= rslt.getReturnValue();
rng.getValuesAsync(1,getRngVals,rslt.getUserContext())
}
function getRngVals(rslt){
rslt.getUserContext().value=rslt.getReturnValue()[0][0]
}
Code Sample 4
Worth noting in the above example is that we did not have to worry about the different concurrent async processes. As long as each callback function is self-contained, i.e., it does not rely on a global that might change over time, the code will execute without problems.
This section illustrated a core difference between how VBA and JavaScript process events. The Excel Mashup API makes life somewhat easier for the VBA developer trying their hand at an Excel Mashup.
A good reference, particularly for those familiar with the Excel object model is Ewa Namespace (http://msdn.microsoft.com/en-us/library/ee589018.aspx). Its structure mimics that of the Excel OM. For example, there are methods (or properties) that are the equivalent of the Workbook property, the Sheets property, the Sheets(index) property, and the Range and the Cells properties.
The sophistication and depth of EWA is nowhere near to that of the Excel OM. Will its sophistication grow? Or will Microsoft lose interest in the product and let it languish? I guess only time will tell.
The workbook contains two worksheets named XY Plot and Polar Plot. The first contains the model to show a XY (or Cartesian) plot, the second to show a Polar plot. The names of these sheets are important because they must match the choices in the web page drop down.
The JavaScript (JS) code running in the browser interacts with a worksheet just as any other code, i.e., referring to a worksheet range either by its address, its name, or its first cell and size. Referring to a range by its address is fraught with maintenance dependencies. Move a cell, either explicitly or implicitly, and the JS code will require an update. Refer to a range by name and that problem disappears.
Also, keep a one-to-one association between web page elements (HTML DOM elements) and worksheet references. This will facilitate AJAX interactions. So, if there are adjacent cells that collectively represent, say, the parameters A, B, D, E, and F, resist the temptation to refer to the 5 cell range collectively as Parameters. Instead, name each individually so that there is a one-to-one association between a cell and its corresponding textbox.
One other important issue is retrieving the formula plotted in the chart. It is in the cell named Func. However, there is no Excel-native means by which one can retrieve the formula in a cell. So, as a workaround, the cell named FuncDesc has the same formula in text form. Consequently, whenever the JavaScript code updates the content of Func, it should also update the content of FuncDesc. When the JavaScript code wants to retrieve the formula, it should retrieve the contents of FuncDesc and not Func, since the latter will return the result of formula, not the formula itself.
Use your Microsoft Live account to logon to skydrive.live.com. To create a workbook accessible to everyone, add the workbook to the Public folder. Then, select the file and from the choices on the right select Embed.

Figure 2
In the Embed dialog box, select the Customize this embedded Excel workbook link.
In the new browser tab that opens, click the JavaScript link and copy the code shown. Strangely, the code is in a very small textbox where only 2 lines show even though there is a lot more code. This copied code goes in the web page.
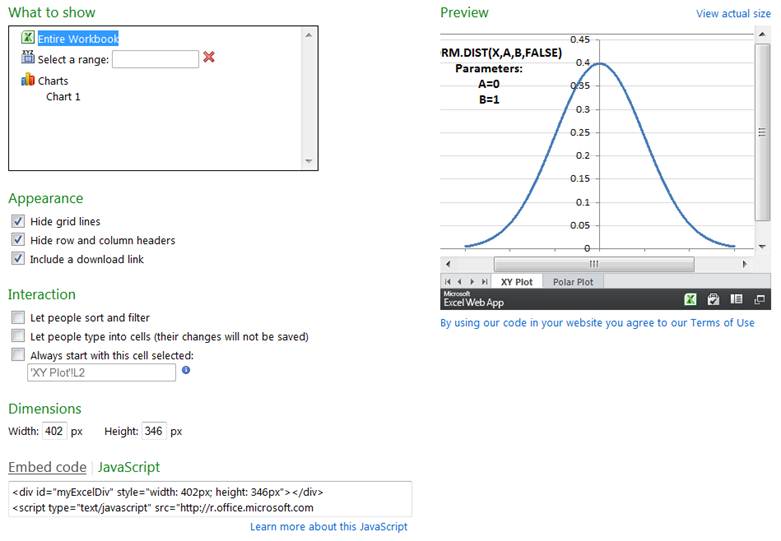
Figure 3
For more on the process, see http://office.microsoft.com/en-us/web-apps-help/make-a-mashup-extend-excel-to-your-web-app-HA102704192.aspx.
The code from the previous section is the minimum necessary to use EWA. It stops at the point of initializing EWA after the web page completes loading. The developer has to write the code for all of the custom processing.
For those unfamiliar with JavaScript cross-browser compatibility or JavaScript event handling, all one needs to know is that when everything is fully loaded, the ExcelMashup code will all the developer written procedure onEwaLoaded.
The first script tag loads the Microsoft provided JS code to interact with the EWA. The second script tag is code that identifies the Excel workbook of interest (the fileToken variable), and initializes the EWA object. When all initialization is complete, the onEwaLoaded will be executed.
Worth noting is that the fileToken string changes whenever a new version of the workbook is uploaded to Skydrive. So, even if one replaces file testWB1.xlsx with a new version of testWB1.xlsx, the identifier for the file will be different. So, each time you upload a new version of the workbook to Skydrive, you will have to get the new file token.
<!DOCTYPE html>
<html>
<head>
</head>
<body>
<script type="text/javascript" src="http://r.office.microsoft.com/r/rlidExcelWLJS?v=1&kip=1"></script>
<script type="text/javascript">
/*
* This code uses the Microsoft Office Excel Javascript object model to programmatically insert the
* Excel Web App into a div with id=myExcelDiv. The full API is documented at
* http://msdn.microsoft.com/en-us/library/hh315812.aspx. There you can find out how to programmatically get
* values from your Excel file and how to use the rest of the object model.
*/
// Use this file token to reference excelmashuptest1.xlsx in Excel's APIs
var fileToken ="SD4C055BD64CBC8FC6!290/5477885497734631366/t=0&s=0&v=!AJCZUSdWYJUvr0o";
// run the Excel load handler on page load
if (window.attachEvent) {
window.attachEvent("onload", loadEwaOnPageLoad);
} else {
window.addEventListener("DOMContentLoaded", loadEwaOnPageLoad, false);
}
function loadEwaOnPageLoad() {
var props = {
uiOptions: {
showGridlines: false,
showRowColumnHeaders: false,
showParametersTaskPane: false
},
interactivityOptions: {
allowParameterModification: false,
allowSorting: false,
allowFiltering: false,
allowPivotTableInteractivity: false
}
};
Ewa.EwaControl.loadEwaAsync(fileToken, "myExcelDiv", props, onEwaLoaded);
}
</script>
Code Sample 5
myExcelDiv is the id for a HTML element that will contain the displayed chart.
For more on the basic requirements for the web page, see http://msdn.microsoft.com/en-us/library/hh315812.aspx.
First, we have to build the web page components. In this case, everything goes into a form named ChangeInput. The form occupies 40% of the width of the webpage.
The Excel chart goes into the DIV element with the id myExcelDiv. The connection between the EWA code and the HTML object is through the reference to myExcelDiv in the call to loadEwaAsync function (the last line in the code above), and the id of the DIV HTML element. [It’s declared in the last line of the HTML code below.]
Each of the form elements has onchange code associated with it. So, whenever the content of a textbox or the drop-down selector changes, the corresponding code is executed.
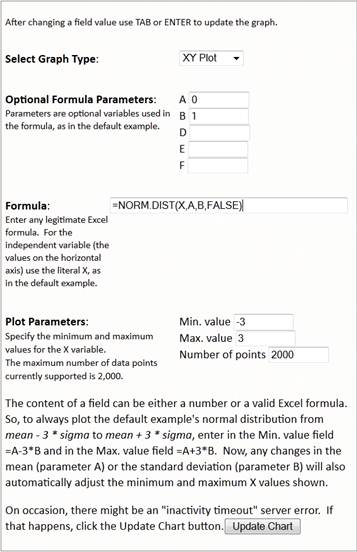
Figure 4
<div style="float:left;width:40%;border:thin grey solid;padding:5px">
<form name="ChangeInput" >
<p class="style1">After changing a field value use TAB or ENTER to
update the graph.</p>
<div style="float:left;width:50%"><p>
<strong>Select Graph Type</strong>:
</p></div>
<div style="float:left;"><p>
<select name="PlotType" onchange="selectPlot(this)">
<option></option>
<option selected="selected">XY Plot</option>
<option>Polar Plot</option>
<option disabled="disabled">3D Plot</option>
</select></p></div>
<div style="clear:both"></div>
<div style="float:left;width:50%"><p>
<strong>Optional Formula Parameters</strong>:
<br />
<font size="2">Parameters are optional variables used in the
formula, as in the default example.</font></p></div>
<div style="float:left;"><p>
A <input id="A" name="A" size="10" onchange="changeEvent(this)" /><br />
B <input id="B" name="B" size="10" onchange="changeEvent(this)" /><br />
D <input id="D" name="D" size="10" onchange="changeEvent(this)" /><br />
E <input id="E" name="E" size="10" onchange="changeEvent(this)" /><br />
F <input id="F" name="F" size="10" onchange="changeEvent(this)" />
</p></div>
<div style="clear:both">
<div style="float:left;width:30%"><p>
<strong>Formula</strong>:<br/>
<font size="2">Enter any legitimate Excel formula. For the independent variable (the values on the
horizontal
axis) use the literal X, as in the default example.</font></p>
</div>
<div style="float:left;"><p>
<input id="Func" name="Func" size="50"
onchange="document.ChangeInput.FuncDesc.value=this.value;
changeEvent(this);changeEvent(document.ChangeInput.FuncDesc)" />
<br/>
<input name="FuncDesc" id="FuncDesc" type="hidden" /></p></div>
</div>
<div style="clear:both">
<div style="float:left;width:50%">
<p><strong>Plot Parameters</strong>:
<br />
<span class="style1">Specify the minimum and maximum values for the X
variable.<br />
The maximum number of data points currently supported is
2,000.</span></p>
</div>
<div style="float:left;">
<p>Min. value <input name="MinVal" size="10" onchange="changeEvent(this)" /> <br />
Max. value
<input name="MaxVal" size="10" onchange="changeEvent(this)" /> <br />
Number of points
<input name="NbrPoints" size="10" onchange="changeEvent(this)"/></p>
</div>
</div>
<div style="clear:both"><p>The content of a field can be either a number or a valid Excel
formula. So, to always plot the default example's normal distribution from
<em>mean - 3 * sigma</em> to <em>mean + 3 * sigma</em>, enter in the
Min. value field =A-3*B and in the Max. value field =A+3*B. Now, any
changes in the mean (parameter A) or the standard deviation (parameter B) will also
automatically adjust the minimum and maximum X values shown.</p>
<p>On occasion, there might be an "inactivity timeout"
server error. If that happens, click the Update Chart
button.<input onclick="JavaScript:setValuesInSheet();" type="button" value="Update Chart"
style="visibility:visible"/>
</p></div>
</form>
</div>
<div id="myExcelDiv" style="width: 550px; height: 550px;float:left;border:thin gray solid;margin:1px"></div>
Code Sample 6
All of the work that the developer does starts with the onEwaLoaded function.
The first thing to do is get a reference to the global ewa variable. In addition, I call the initializeWB function.
var ewa = null;
function onEwaLoaded(asyncResult) {
/*
* Add code here to interact with the embedded Excel web app.
* Find out more at http://msdn.microsoft.com/en-us/library/hh315812.aspx.
*/
if (asyncResult.getSucceeded())
{
// Use the AsyncResult.getEwaControl() method to get a reference to the EwaControl object
ewa = asyncResult.getEwaControl();
initializeWB();
}
else
{
alert("Async operation failed!");
}
}
Code Sample 7
The initializeWB function takes the information from the workbook and updates the various fields in the webpage.
We have already seen how a change to the content of a textbox is handled (see Development Paradigm).
Next, we look at how to process a change in the PlotType drop-down. Since the workbook contains a different worksheet for each of the plot types, we have to get Excel Services to switch worksheets. Once that switch is complete, we will update the web page with the contents of the newly active worksheet.
Any change in the selection of PlotType will result in a call to the selectPlot function with the parameter of this. selectPlot asynchronously requests a change in the active sheet providing sheetChangeDone as the callback function. When the active sheet change is complete, sheetChangeDone loads the content of the HTML form with the contents of the worksheet by calling the getValuesInSheet function. The code in getValuesInSheet is discussed in detail in Development Paradigm.
function selectPlot(obj){
ewa.getActiveWorkbook().getSheets().getItemByName(obj.value).activateAsync(sheetChangeDone,null)
}
function sheetChangeDone(rslt){
getValuesInSheet();
}
Code Sample 8
In the context of an Excel mashup, since we are using web page elements and Javascript to interact with the Excel workbook, it would be nice if we can keep the consumer for directly interacting with the workbook. Unfortunately, that is not possible.
When it comes to cells, the common way to protect cells is to lock those we do not want the user changing, leaving only those meant for user input unlocked, and then protecting the worksheet. Unfortunately, Excel Services will not work with a protected workbook!
Luckily, a workaround is to hide all the cells in the worksheet as was done in the example workbook. Only those cells under the chart were left visible.
This leaves one thing that the user can do and that is click on a sheet tab. Since sheet tabs cannot be hidden in Excel Services, there is no way to block such a click. To deal with the possibility that the user clicks on an arbitrary sheet tab, the code in changeEvent needs to check if the active sheet is the same as the one shown in the PlotType dropdown. If it is not, the code initiates a ‘change sheet’ request and defers the processing of the change event request until after the sheet change is completed.
function changeEvent(obj){
var SheetName = ewa.getActiveWorkbook().getActiveSheet().getName()
if (SheetName != document.ChangeInput.PlotType.value){
ewa.getActiveWorkbook().getSheets().getItemByName(
document.ChangeInput.PlotType.value).activateAsync(redoChange,obj);
}
else {
ewa.getActiveWorkbook().getRangeA1Async(
"'" + SheetName + "'!" + obj.name, updateRange, obj);
}
}
function redoChange(rslt){
changeEvent(rslt.getUserContext())
}
Code Sample 9
This document takes the reader through the steps required to create an Excel mashup. The final web page is at http://www.tushar-mehta.com/publish_train/data_visualization/excelmashup/index.htm. Once on that page, one can look at the complete source for the page and also download the associated Excel workbook.

