1. Introduction
2. Basic Charts
3. Productivity in Excel 2010 charts
4. More charts in Excel -- extensions of basic charts
5. Color in Excel 2010 charts -- leveraging Office themes
7. The worksheet as a charting canvas -- I
8. The worksheet as a charting canvas -- II
9. Dynamic Charts
9e
Time Snapshot and Tracing a Path
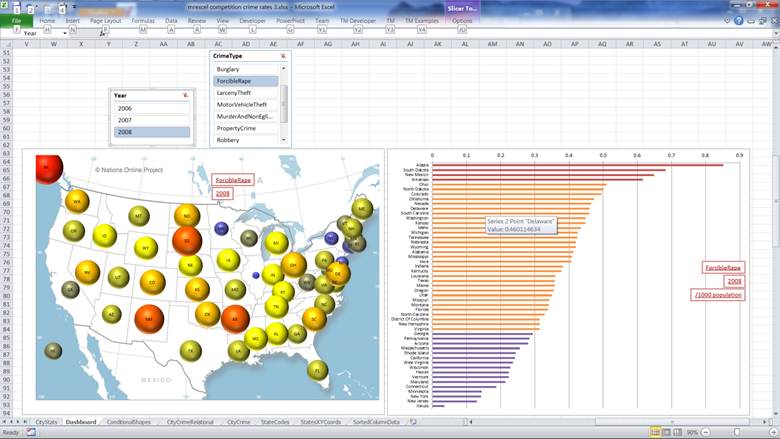
10. Dashboards
11. PivotCharts
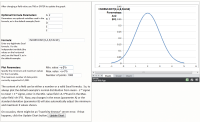
12. Plotting equations
13. Non-traditional visual displays
14. How to convert an idea into a chart
15. Exporting charts
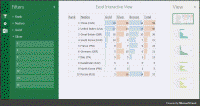
15a. Excel on the
web - Excel Mashup
15b. Excel on the web
- Excel Mashup 2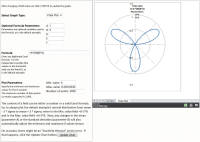
16. Visual Basic and charts